Trading financial markets often feels like trying to read a hidden language. Price charts move in seemingly chaotic ways, leaving many retail traders frustrated and confused. However, institutional traders view these same charts differently. They look for specific footprints left by large market participants. One of the most powerful footprints you can learn to spot is the fair value gap.
Understanding how price moves between different zones of liquidity can completely change your perspective on technical analysis. A fair value gap acts like a magnet for future price action. When the market moves too quickly in one direction, it leaves behind an imbalance. Price naturally wants to return to this area to restore balance.
By the end of this guide, you will understand exactly what a fair value gap is, how to spot it on a chart, and how to build a trading strategy around it. You will learn the differences between bullish and bearish gaps, how they apply to various markets like forex and crypto, and the common mistakes you need to avoid.
What Is a Fair Values?
A fair value gap (FVG) is a specific price pattern that occurs when a financial asset moves aggressively in one direction, creating an imbalance in the market. It is a concept heavily popularized by the Inner Circle Trader (ICT) methodology. An FVG represents a zone on a price chart where buying and selling were not equal.
During normal market conditions, buyers and sellers constantly exchange assets, creating overlapping price action. But when massive volume enters the market—often from banks or financial institutions—the price jumps or drops rapidly. This leaves a “gap” where no trading occurred at certain price levels.
How Does a Fair Value Work?
The mechanics of a fair value gap rely on the concept of market efficiency. Efficient markets strive for a balance between buyers and sellers. When a large institutional order executes, it consumes all the available liquidity at the current price level and forces the price to surge or plummet.
This aggressive movement creates an inefficiency. The market views this gap as unfinished business. Because financial markets naturally seek equilibrium, price action often returns to the fair value gap at a later time. The purpose of this return is to offer fair value to market participants who missed out during the initial rapid expansion. Once the price fills the gap, the market is considered balanced, and the price can resume its original trend.
Fair Value Gap Meaning in Trading
In practical trading terms, a fair value gap means an area of high-probability support or resistance. Traders use the FVG as a targeted zone for entry or exit.
When you see a fair value gap on your chart, it signals that heavy institutional involvement recently took place. Retail traders cannot move the market rapidly enough to create true fair value gaps. Therefore, trading alongside these gaps means you are aligning your positions with institutional money. You are no longer guessing where the market might bounce; you are waiting for the market to rebalance a known inefficiency before joining the dominant trend.
Why Fair Value Gaps Matter in the Market
Fair value gaps matter because they provide context to price movements. Many traditional technical analysis indicators lag behind the current price. Moving averages and oscillators tell you what happened in the past. A fair value gap, on the other hand, gives you a predictive framework based on actual market structure and order flow.
These gaps act as hidden magnets. They explain why price sometimes reverses abruptly in the middle of a trend without touching a traditional support or resistance line. By incorporating FVGs into your analysis, you gain a deeper understanding of institutional order flow and liquidity runs.
Types of Fair Value Gaps
Not all fair value gaps look the same. They depend entirely on the direction of the aggressive price movement. Traders generally classify them into two distinct categories.
Bullish Fair Value Gap
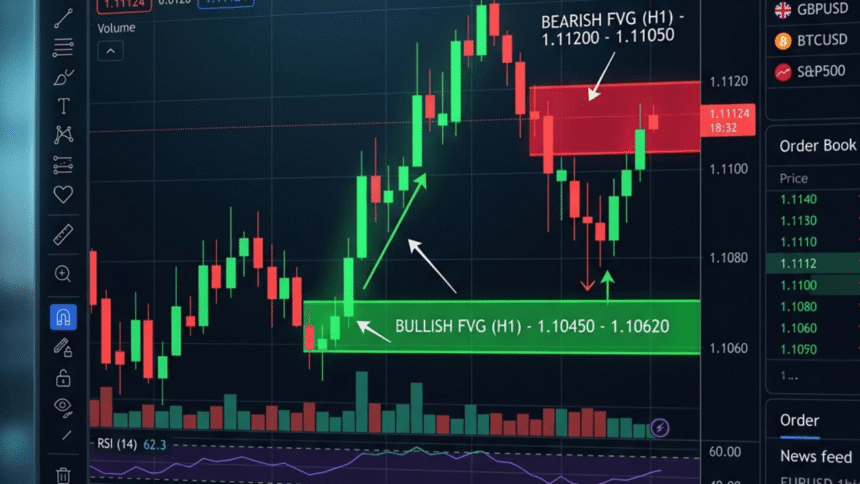
A bullish fair value gap forms during a rapid upward price movement. It consists of a three-candle sequence. The gap is the empty space between the high of the first candle and the low of the third candle. This happens because the second candle was a massive green (upward) candle, and the subsequent price action failed to overlap with the first candle’s high. Traders expect the price to retrace downward into this gap to find support before continuing its upward rally.
Bearish Fair Value Gap
A bearish fair value gap occurs during a sharp downward price drop. Similar to the bullish version, it uses a three-candle sequence. The gap exists between the low of the first candle and the high of the third candle. The second candle is a large red (downward) candle. When the market creates a bearish FVG, traders anticipate that the price will eventually pull back up into this empty space, find resistance, and then continue dropping.
How to Identify a Fair Value Gap on a Chart
Identifying a fair value gap requires you to look at a three-candle sequence. You need to focus on the wicks of the candles, not just the bodies.
First, locate a large, impulsive candle (the second candle in the sequence). Next, look at the candle immediately preceding it (candle one) and the candle immediately following it (candle three). For an upward move, check the high of candle one and the low of candle three. If they do not touch or overlap, the space between them is your fair value gap. For a downward move, check the low of candle one and the high of candle three. If there is empty space between those two points, you have found a bearish FVG. Draw a rectangle connecting these two price points and extend it to the right side of your chart.
Fair Value Gap Trading Strategy
A basic fair value gap trading strategy involves waiting for the price to return to the gap. You do not trade the initial breakout. Instead, you wait for patience to pay off.
When the price retraces into the FVG, you look for signs of rejection on a lower timeframe. If you are trading a bullish gap, you want to see the price enter the gap and then form a bullish reversal pattern, like a hammer or a strong green candle. You place your buy order inside the gap, put your stop loss slightly below the bottom of the FVG, and target the recent swing high for your take profit.
Best Timeframes for Fair Value Gap Trading
Fair value gaps appear on every timeframe, from the 1-minute chart to the monthly chart. The best timeframe depends entirely on your trading style.
Day traders often find great success using the 5-minute and 15-minute charts. These timeframes provide enough volatility to create gaps during major trading sessions, such as the London or New York opens. Swing traders prefer the 1-hour, 4-hour, and daily charts. FVGs on higher timeframes carry much more weight and reliability, as it takes significantly more institutional capital to create an imbalance on a daily chart compared to a 1-minute chart.
Fair Value Gap vs Liquidity Gap
Traders sometimes confuse fair value gaps with liquidity gaps, but they are slightly different concepts.
A fair value gap is a three-candle pattern where the wicks of the first and third candles do not overlap, leaving a space around the massive second candle. A liquidity gap usually refers to an actual blank space on the chart where the price jumped completely from one level to another without any candles printing in between. Liquidity gaps happen frequently over weekends in the forex market or between trading days in the stock market. Both represent inefficiencies, but they look visually different on the chart.
Fair Value Gap vs Order Block
An order block and a fair value gap frequently work together, but they serve different functions.
An order block is the last down candle before a strong upward move, or the last up candle before a strong downward move. It represents the exact area where institutions accumulated their positions. The fair value gap is the imbalance created after the price leaves the order block. High-probability trade setups occur when a fair value gap sits directly next to an order block, creating a powerful zone of support or resistance.
How Institutional Traders Use Fair Value Gaps
Institutional traders use fair value gaps to scale into large positions without alerting the broader market. When an institution needs to buy millions of shares or large lots of currency, doing it all at once causes slippage.
They push the price aggressively, creating the gap. Later, they allow retail traders to push the price back into the gap. The institutions then use that returning liquidity to execute the rest of their orders at a fair price before driving the market higher or lower. Understanding this allows retail traders to piggyback on institutional algorithms.
Common Fair Value Gap Patterns
You will frequently see fair value gaps form during specific market cycles. Breakout gaps occur when the price escapes a long consolidation phase. Runaway gaps happen in the middle of a strong trend, acting as a continuation signal. Exhaustion gaps form near the end of a trend, trapping late buyers or sellers before a major reversal. Recognizing the context around the FVG helps determine its validity.
Advantages of Using Fair Value Gaps
Trading with fair value gaps offers several distinct advantages. It simplifies your charts by removing the need for complex, lagging indicators. It provides precise entry and exit points, which makes calculating risk-to-reward ratios incredibly straightforward. Most importantly, it aligns your trading psychology with the realities of market mechanics, focusing on where liquidity actually sits rather than where a trendline dictates it should go.
Risks and Limitations
No trading concept works perfectly every time. Fair value gaps are no exception.
Sometimes, a gap acts as a breakaway gap and never gets filled, leaving you waiting on the sidelines for a pullback that never arrives. In highly volatile markets, price can slice straight through a fair value gap, hitting your stop loss before reversing. Relying strictly on FVGs without looking at higher timeframe trends or overall market context often leads to poor trading decisions.
Common Mistakes Traders Make with FVG
A frequent mistake is trying to trade every single gap that appears on the chart. Not all FVGs are tradable. If a gap forms in a choppy, sideways market, it holds very little predictive power.
Another common error is entering a trade the exact second the price touches the gap. Experienced traders wait for lower timeframe confirmation. Plunging blindly into a gap without waiting to see if the market actually respects the zone is a fast way to lose capital.
Fair Gap in Forex Trading
The forex market runs 24 hours a day, five days a week. This continuous price action makes fair value gaps highly reliable. In forex, FVGs frequently form during major economic news releases, such as the Non-Farm Payrolls (NFP) or central bank interest rate decisions. Traders wait for the initial news spike to create the gap, and then trade the subsequent retracement a few hours later.
Fair Value in Stock Market Trading
In the stock market, fair value gaps work exceptionally well on daily timeframes. Due to market open and close times, standard liquidity gaps (actual jumps in price from Friday’s close to Monday’s open) are common. However, intraday FVGs also form frequently during the first hour of the New York session when institutional volume is highest. These gaps often dictate the direction of the stock for the remainder of the day.
Value Gap in Crypto Trading
Cryptocurrency markets operate 24/7 and are highly algorithmic. This makes crypto charts incredibly respectful of fair value gap. Since there are no market closes, institutional algorithms rely heavily on liquidity pools and FVGs to navigate the market. Bitcoin and Ethereum charts routinely show massive FVGs during aggressive bull runs or flash crashes, providing excellent bounce zones for crypto traders.
Best Indicators
While you can spot FVGs with the naked eye, some indicators help automate the process. Many charting platforms like TradingView offer custom “fair value gap” or “Imbalance” indicators created by the community.
Additionally, combining FVGs with the Fibonacci Retracement tool is highly effective. If an FVG lines up perfectly with the 0.618 or 0.786 Fibonacci level, it significantly increases the probability of a successful trade. Volume profiles can also confirm if the gap represents a true lack of trading volume.
Step-by-Step Example
Let us walk through a hypothetical trade. You are watching the EUR/USD on a 1-hour chart.
- The market is in an uptrend.
- A massive green candle forms, breaking through previous resistance.
- You observe the candle before and after this green candle. Their wicks do not overlap, leaving a 15-pip fair value gap
- You mark the zone with a rectangle and wait.
- Three hours later, the price drops back into your rectangle.
- You zoom into the 5-minute chart and see a bullish engulfing pattern form inside the gap.
- You enter a buy trade, place your stop loss just below the gap, and target the recent high. The price respects the zone and moves to your target.
Tips for Beginners
If you are new to this concept, start by simply identifying gaps on historical charts. Do not trade live money right away. Scroll back through weeks of data and draw rectangles around every FVG you see. Notice how price reacts to them.
Only trade gaps that align with the overall higher timeframe trend. If the daily chart is trending up, only look for bullish fair value gaps on the 1-hour chart. Ignore the bearish ones, as they are likely to fail.
Frequently Asked Questions About Fair Value
Does every fair value gap get filled?
No. While the market naturally seeks efficiency, runaway gaps in strong trends can remain unfilled for weeks, months, or sometimes years.
What happens if the price closes completely past the FVG?
If a candle body closes significantly beyond the fair value gap, the gap has failed as support or resistance. The market structure has shifted, and you should likely abandon the trade idea.
Can I use FVGs on 1-minute charts?
Yes, but they require fast reaction times and are subject to more “noise.” Beginners should stick to the 15-minute chart or higher to filter out false signals.
Mastering Price Inefficiencies
Understanding the fair value gap bridges the divide between retail confusion and institutional clarity. By recognizing these areas of market imbalance, you stop chasing wild price movements and start waiting for the market to come to you.
While it takes practice to train your eyes to spot the right three-candle sequences, the payoff is a much clearer view of market structure. Combine this strategy with proper risk management and patience, and you will have a formidable tool for navigating any financial market. Start marking up your charts today, observe how price reacts to these hidden magnets, and take your technical analysis to the next level.